
Published Opportunity Performance tracks the outcome of Regimyx’s own published research — not any individual member’s personal portfolio or trading results.
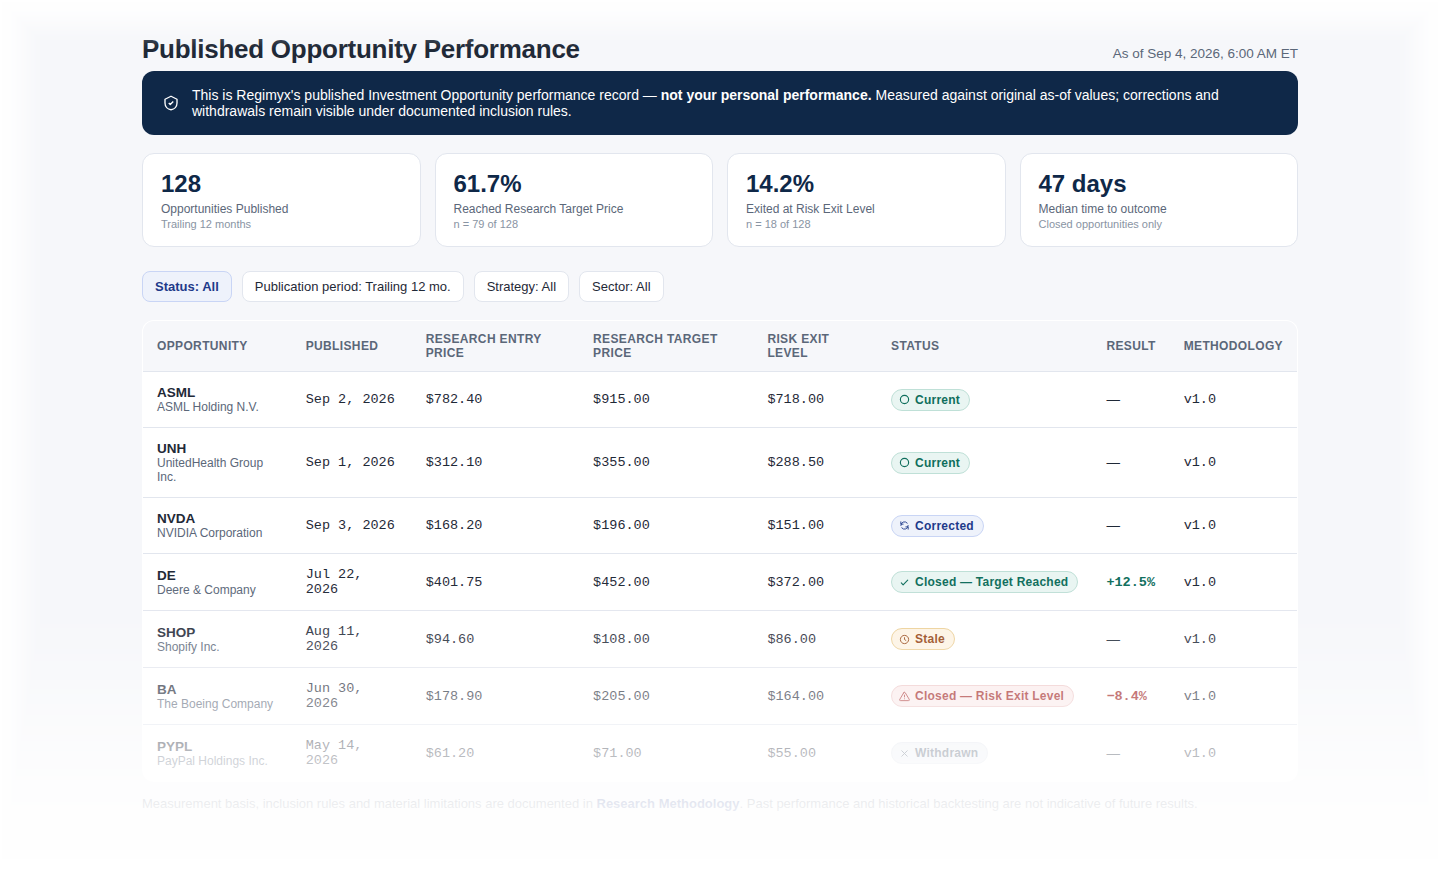
This is what Published Opportunity Performance looks like inside the Regimyx application, using illustrative demonstration data. Regimyx provides investment research and AI-assisted decision intelligence for informational and educational purposes only, and does not provide personalized investment, financial, legal, or tax advice. See full disclosures in Research Methodology.
Summary Metrics
—
Total Published Opportunities
—
Win Rate
—
Average Return
—
Average R-Multiple
Metrics shown as placeholders pending governed Published Opportunity Performance data. No live or historical performance figures have been populated.
Performance Chart
Performance chart placeholder — ready for application/data integration. Replace with a live chart once governed performance data is available.
Published Opportunity History
Demonstration rows shown below — replace with real Published Opportunity records once available.
| Symbol | Publication Date | Research Entry Price | Research Target Price | Risk Exit Level | Outcome | Return | R-Multiple |
|---|---|---|---|---|---|---|---|
| DEMO | Demo | Demo | Demo | Demo | Demo | Demo | Demo |
| DEMO | Demo | Demo | Demo | Demo | Demo | Demo | Demo |
| DEMO | Demo | Demo | Demo | Demo | Demo | Demo | Demo |
Performance Methodology
Calculation methodology must be transparent. Published Opportunity Performance is calculated using a consistent, disclosed methodology applied to every published Investment Opportunity — see the Research Methodology and Performance Disclosure pages for full detail.